07.2.2026 Bahar Gidwani
Part 1 of a 2-part series.
In 2008 CSRHub began measuring performance in corporate social responsibility (CSR). Using ten years of history, we are now starting to answer questions such as:
- Has CSR performance improved over time?
- What area of CSR is improving the most?
- Is the universe of companies for which ratings are available expanding beyond the large public corporations?
- How strong is the alignment between CSR performance and company CSR reporting on CSR?
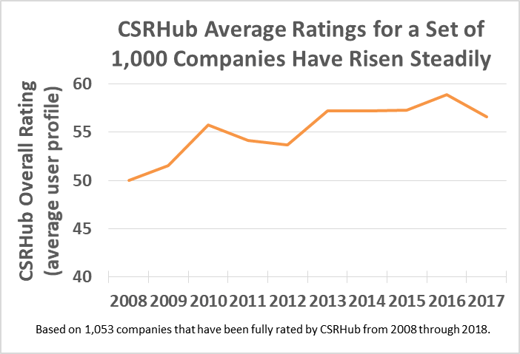
Steady Overall Improvement
CSRHub’s ratings incorporate the input of virtually every major source of opinion about how companies treat environment, social, and governance (ESG) issues. Our patented methodology weights and combines these opinions in a way that makes them comparable both between companies and over time.
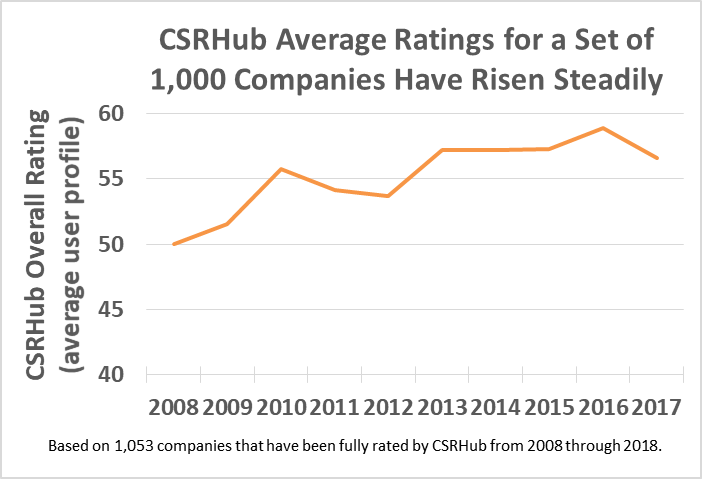
The chart below on Average CSRHub Ratings shows that since 2008, average ratings increased by almost 9 points to a peak in 2016. They fell somewhat over the last two years, but have still ended up by 6 points over ten years. Even from 2008 to 2010, through the worst of the Great Recession, ratings rose. The year-to-year changes are modest and gradual over time, suggesting there have been fundamental changes in business strategy for these companies during this period.
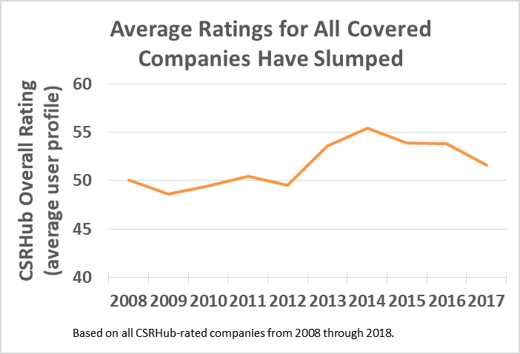
Growth in the universe of rated companies may have diminished this improvement
We only provided sustainability ratings for around 2,000 companies in 2008—we could only find about 50 ESG data sources at that time. By now, we have gathered data on more than 140,000 companies from 550 sources—and offer ratings on more than 18,000. The growth in our ratings universe appears to have diminished the overall increase in ratings.
The chart below shows that the average rating for all companies in our universe rose more slowly through 2014 than for the consistent set shown above. Then, as a flood of new companies began reporting information, the average rating for all companies has slowly dropped.
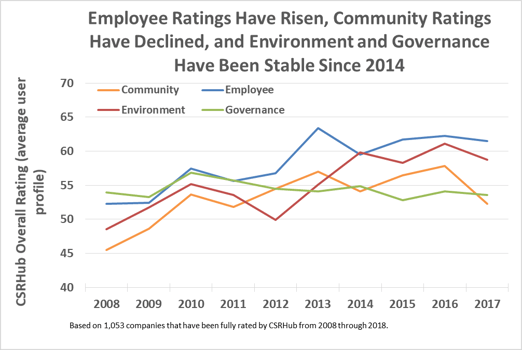
Clear Shifts in Emphasis – the top rated CSRHub category for most years has been “Employees”
Our overall ratings are based on twelve subcategory ratings that in turn feed four different category scores. We’d written previously about the fact that the emphasis between our four category scores seemed to shift over time.
These shifts appear to be continuing. Governance rose sharply during the 2008-10—probably as a response to the 2008 financial crisis. Environment ratings surged in between 2012 and 2016, as companies responded to pressure on climate change and water issues. Employee issues have remained the most highly rated area since 2010 while Community ratings started as the lowest in 2008 and have stayed near the bottom. The idea that companies are more concerned about their employees than the community they live in is something we believe other ratings groups have not yet noticed.
Look for part 2 in our series tomorrow, as we continue to explore CSR trends.

 Bahar Gidwani has built and run large technology-based businesses for many years. Bahar holds a CFA (Chartered Financial Analyst) and was one of the first people to receive the FSA (Fundamentals of Sustainability Accounting) designation from SASB. Bahar worked on Wall Street with Kidder, Peabody, and with McKinsey & Co. He has founded several technology-based companies and is a co-founder of CSRHub, the world’s broadest source of corporate social responsibility information. He has an MBA from Harvard Business School and an undergraduate degree in physics and astronomy. He plays bridge, races sailboats, and is based in New York City
CSRHub is the largest ESG and sustainability rating and information platform globally. We aggregate 180M data points from 550+ data sources including 12 leading ESG analyst databases. Our patented algorithm aggregates, normalizes, and weights data to rate 18,000 companies in 132 countries across 136 industries. We track 97% of world market capitalization. We cover 12 subcategories of ratings and rankings across the categories of environment, employees, community and governance. We show underlying data sources that contribute to each subcategory’s ratings. CSRHub metrics are a consensus view (any 2 sources may have about a 30% correlation so we make sense of the disparate data). We tag companies for their involvement in 17 Special Issues. We provide Macro-enabled Excel dashboard templates, customizable dashboards, and an API. Our big data technology enables 85% full coverage of data across our rated companies and robust analyses. We provide historical ratings back to 2008.