The following is part 2 of a 3-part series on “Big Data.”
By Bahar Gidwani
We have previously defined “Big Data” and shown how we feel it could help address some problems that exist in collecting corporate social responsibility (CSR) and sustainability data on companies. We have also further described the problems with the currently dominant method of gathering this data—an analyst-based method.
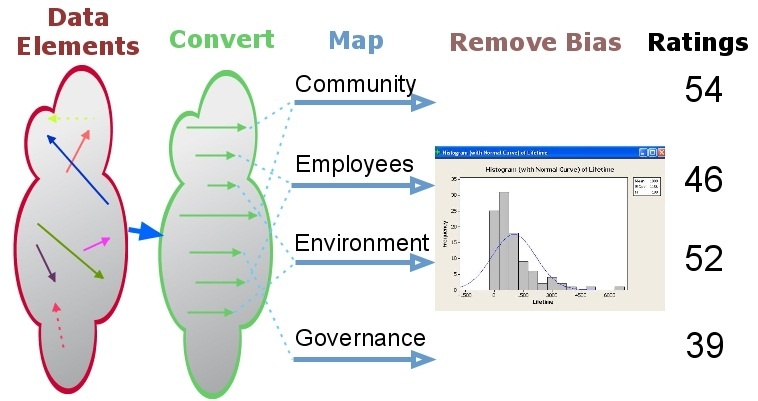
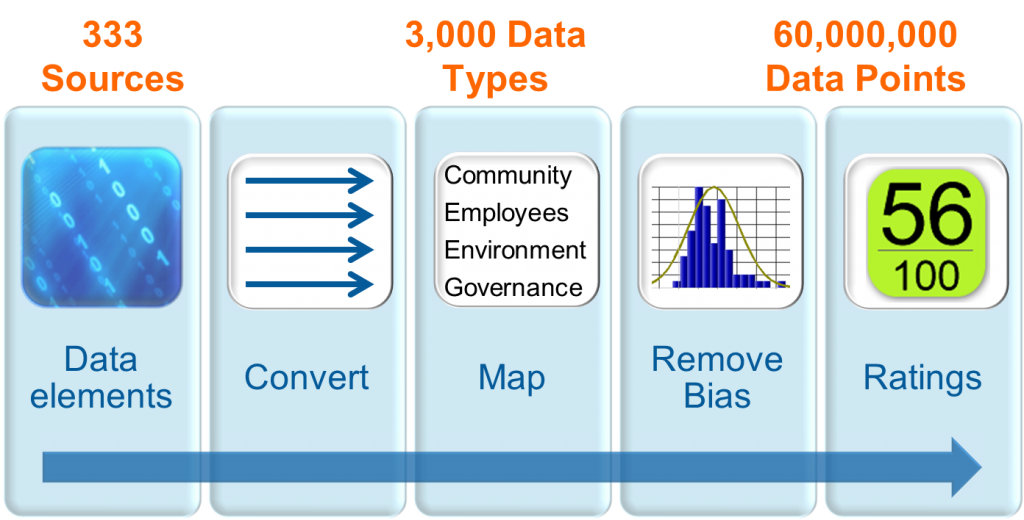
CSRHub uses input from investor-driven sources (known as “ESG” for Environment, Social, and Governance or “SRI” for Socially Responsible Investment), non-governmental organizations, government organizations, and “crowd sources” to construct a 360 degree view of a company’s sustainability performance. To better understand this process, let’s consider an example.
Hewlett Packard is a heavily tracked company. We have 56 sources of data for this company that together contribute 494 different rating elements. We map each of these elements into one of twelve different CSR subcategories. For instance, here are mappings for 20 of the elements that contribute to the Hewlett Packard rating:
Description of Data Element |
Subcategory Mapping |
Source |
| Participant in the Walmart Sustainability Assessment | Environment Policy & Reporting | Carbon Disclosure Project 2010 Full Data |
| Better World product rating | Product | Better World Companies |
| Board Structure/Board Diversity | Board | Thomson Reuters Asset4 |
| Commitment to Society and to Human Rights Protection Policies | Leadership Ethics | ISOS Group Assessments |
| Committed to improving sustainability performance | Human Rights & Supply Chain | BSR Member |
| Corporate Governance Rank | Transparency & Reporting | CR’s 100 Best Corporate Citizens 2011 |
| Green House Gas (GHG) Footprint | Energy & Climate Change | Trucost |
| Human Rights/ Child and Forced Labor Issues | Community Dev & Philanthropy | MSCI ESG Intangible Value Assessment |
| Member of the Electronic Industry Citizenship Coalition | Human Rights & Supply Chain | Electronic Industry Citizenship Coalition |
| Most Admired Companies for Minority Professionals in 2011 | Diversity & Labor Rights | BlackEngineer Most Admired Companies 2011 |
| North America 300 Carbon Rank | Energy & Climate Change | Environmental Investment Organisation |
| Number of corporate sustainability reports issued | Transparency & Reporting | CorporateRegister.com |
| Number of EPEAT certified products | Environment Policy & Reporting | EPEAT |
| On FCPA Corporate Investigations List | Leadership Ethics | FCPA Corporate Investigations |
| Same-sex benefits | Compensation & Benefits | IW Financial |
| Statement references corruption | Leadership Ethics | UN Global Compact 2010 |
| Top 100 most accountable companies according to AccountAbility | Transparency & Reporting | AccountAbility |
| Top 50 Socially Responsible | Environment Policy & Reporting | Top 50 Socially Responsible |
| Supports UN Drugs and Crime Anti-Corruption Measures | Leadership Ethics | UN Office on Drugs and Crime Anti-Corruption Measures |
| Working Mother list 2010 | Compensation & Benefits | Working Mother List 2010 |
Some of these data elements could map to more than one subcategory. For instance, a company that is on the list of “Best Workplaces for Commuters” would get credit both for its energy saving effort (in “Energy & Climate Change”) for the benefit its programs bring to its employees (in “Compensation & Benefits).
The list above includes examples of each of the three main contributors to the system: Investment-related sources (Asset4/Thomson Reuters, Carbon Disclosure Project, GovernanceMetrics International/Corporate Library, IW Financial, MSCI, Trucost, Vigeo); Activists and NGOs (Accountability, BSR, CorporateRegister, CR 100, EIO, FCPA, Top 50 Socially Responsible); and Government & Consumer (Better World, Black Engineer, EICC, EPEAT, UN Global Compact, UNODC, Working Mother). The completed mapping process connects the 494 data elements from the 56 sources for HP into our twelve subcategories in 971 different ways.
|
Subcategory |
Investment-Related |
Activists & NGOs |
Government & Consumer |
Total By Subcategory |
| Board |
67 |
12 |
1 |
80 |
| Community Dev & Philanthropy |
39 |
16 |
10 |
65 |
| Compensation & Benefits |
34 |
6 |
6 |
46 |
| Diversity & Labor Rights |
51 |
8 |
13 |
72 |
| Energy & Climate Change |
37 |
44 |
15 |
96 |
| Environment Policy & Reporting |
46 |
69 |
14 |
129 |
| Human Rights & Supply Chain |
40 |
19 |
8 |
67 |
| Leadership Ethics |
80 |
27 |
14 |
121 |
| Product |
56 |
8 |
6 |
70 |
| Resource Management |
46 |
31 |
11 |
88 |
| Training, Health & Safety |
30 |
6 |
2 |
38 |
| Transparency & Reporting |
51 |
30 |
18 |
99 |
| Total By Type |
577 |
276 |
118 |
971 |
While investment-related sources contribute more data elements than the other types, there are at least some of each type present in each subcategory. Another way to look at this is to see that many sources contribute to each subcategory:
| Subcategory |
Number of Sources |
Total Elements |
| Board |
11 |
80 |
| Community Dev & Philanthropy |
21 |
65 |
| Compensation & Benefits |
18 |
46 |
| Diversity & Labor Rights |
23 |
72 |
| Energy & Climate Change |
24 |
96 |
| Environment Policy & Reporting |
25 |
129 |
| Human Rights & Supply Chain |
23 |
67 |
| Leadership Ethics |
29 |
121 |
| Product |
14 |
70 |
| Resource Management |
24 |
88 |
| Training, Health & Safety |
13 |
38 |
| Transparency & Reporting |
25 |
99 |
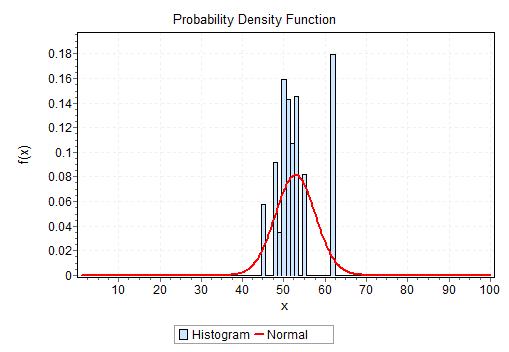
Each value from each data element is converted into a zero to 100 rating (zero = lowest, 100 = highest). These scores are then adjusted by comparing them to each other. In the example above, there are 11 sources for HP’s board performance. Suppose three of them gave it a great rating, six a medium rating, and two a poor one. Computer analytics would guess that the six scores that agree are correct and that HP’s board rating is in the medium range. The assumption is that three sources tended to be biased towards high scores and two towards low scores. This chart shows the actual distribution of scores at the subcategory level, along with a calculation of the “normal” error curve that results.
When the analysis is repeated across thousands of companies, a picture emerges as to which sources tend to be overly positive or negative and which tend to predict the “mean” of the other sources. All sources can be adjusted, based on this feedback—moving them up or down so they more accurately match the opinion of all other sources. After a large number of iterations in this process, there is a consensus score for each subcategory for each company analyzed.
By making a few assumptions about how the errors in data are distributed, one can assess the accuracy of ratings. In a previous post, we showed that CSRHub’s overall rating accurately represents the values that underlie it to within 1.8 points at a 95% confidence interval.
In our next post, we will discuss the benefits and drawback of using this complex and data intensive approach to measuring company CSR performance.
Bahar Gidwani is a Cofounder and CEO of CSRHub. Formerly, he was the CEO of New York-based Index Stock Imagery, Inc, from 1991 through its sale in 2006. He has built and run large technology-based businesses and has experience building a multi-million visitor Web site. Bahar holds a CFA, was a partner at Kidder, Peabody & Co., and worked at McKinsey & Co. Bahar has consulted to both large companies such as Citibank, GE, and Acxiom and a number of smaller software and Web-based companies. He has an MBA (Baker Scholar) from Harvard Business School and a BS in Astronomy and Physics (magna cum laude) from Amherst College. Bahar races sailboats, plays competitive bridge, and is based in New York City.
CSRHub provides access to corporate social responsibility and sustainability ratings and information on nearly 5,000 companies from 135 industries in 65 countries. By aggregating and normalizing the information from over 170 data sources, CSRHub has created a broad, consistent rating system and a searchable database that links millions of rating elements back to their source. Managers, researchers and activists use CSRHub to benchmark company performance, learn how stakeholders evaluate company CSR practices and seek ways to change the world.


